Product Experimentation Framework
Here is an experimentation program (from the data perspective) that I have designed. This framework is intended to show how a product analyst collaborates with a product manager and what role each person plays within experimentation. It also shows each step of experimentation from the planning stage to post experimentation.
Overview of Framework

Detailed Framework
Planning
In order to have success in experimentation, the first step is to identify the goals of the team. This should incorporate quantitative data and qualitative feedback from the product. With this data, we should identify the problems we currently see with the product and the users and platforms impacted by these problems.
The next step is to identify the potential solutions to those problems by brainstorming on ideas and features that can solve the problems. This process should be a collaborative effort involving market research, customer feedback, and comparison to competitors.
After ideation, we need to understand the value of each feature implemented. Value should be identified by incorporating the time it takes engineers (iOS, Android, Web), product designers, and product analyst to implement this feature, the percentage of the user population impacted, and the confidence level of how the feature impacts our goals.
After we have assessed the features, organized them, and built a roadmap to implement them, the product analyst should define the primary metric needed to evaluate whether the feature implemented is successful. This metric will tell us whether the test wins or loses and should track how the changes made affect visitor behavior. This metric should also directly relate to the goals of the team. After the primary metric is decided, we need to define the secondary metrics and guardrail metrics. The secondary metrics should be metrics that give us additional information about visitor behavior and the guardrail metrics should measure engagement with the feature (eg. page views, feature view, clicks). This information can be logged in a PRD (Product Requirement Document).
Once the main metrics of the experiment are decided the sample size and run length of each experience should be defined. These are the inputs needed to derive a sample size using an AB test sample size calculator (example: Evan Miller):
Baseline Conversion Rate - current conversion rate for primary metric
Depending on the metric and seasonality this could be tracked at a weekly or monthly basis
Minimum Detectable Effect - how much change from baseline i want to detect (how big or small of a lift)
More traffic is needed to detect small changes and less traffic is needed to detect large changes
Statistical Significance - determination that a relationship between variables is caused by something other than chance
Standard statistical significance is 90%-95%
The output of the calculation will result in the sample size needed for each variant. We can then use this information in combination with the traffic on the page we are targeting to understand how long it will take to achieve the sample size required for each variant to reach statistical significance.
Implementation
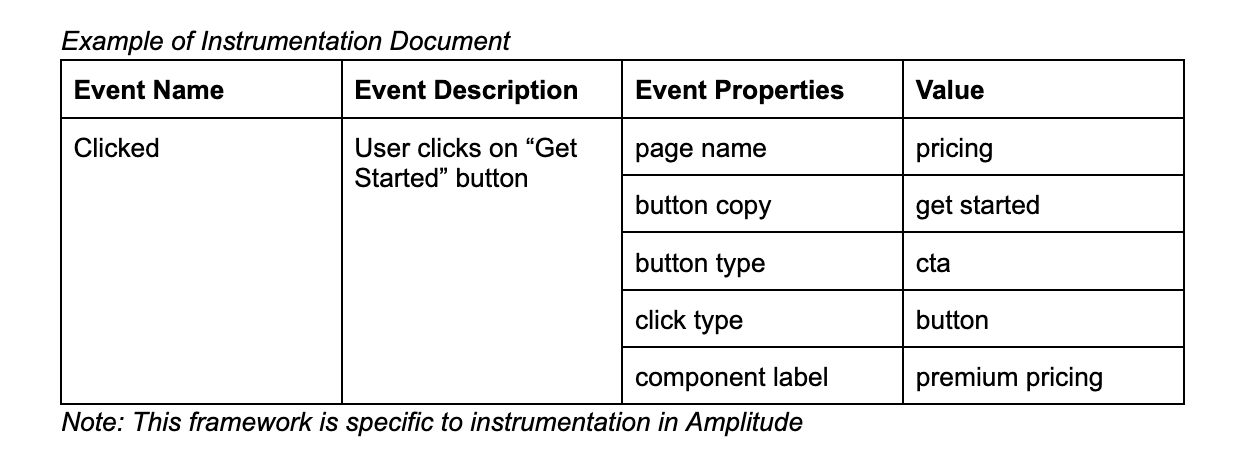
Next the product analyst should identify what data currently exists within the database and what events exist in the web analytics tool for each feature. Once the product analyst identifies what exists and what needs to be built out, they should then collaborate with other teams to start that process. For database metrics, the analyst should collaborate with engineering teams to define what table the metric should go into (existing or new). For event based metrics, the analyst should develop an instrumentation document and present it to their product manager and engineers to implement. This document should uniquely identify events and event properties that need to be instrumented, while also being able to adhere to the current standards of the company for event creation and manipulation.
Next the product analyst should assess what additional queries and information is needed to evaluate the test. This can include writing queries to run in the database, flagging existing dashboards, and creating a dashboard.
QA
QA begins once the feature is ready to be tested in a staging environment. This includes QAing new data in the database and/or by triggering new events and event properties created for the feature. Testing should be done on each platform the feature will be on either using personal logins or test accounts.
Next a test dashboard should be created in the staging environment by the product analyst. This dashboard should capture the primary metric, secondary metrics, and guardrail metrics and be able to compare across variants. Dashboards should be QAed by another analyst to ensure that everything looks correct.
Experiment Launch
Once the QA is complete, the test is ready to launch. The product analyst should move the dashboard from staging to production and keep a close watch on it for the first few days. Sample size in each variant and engagement with the feature should be monitored to ensure the test is running properly. The product analyst should periodically send updates to stakeholders on test performance and should perform ad hoc analyses on the test that are needed for a deeper dive into the data.
Post Experiment
Once the sample size and run time is achieved, the results of the test should be analyzed. The primary kpi should be used to determine whether the test wins or loses. Then the results of the test should be examined to understand next steps. Next steps can include releasing the feature to all visitors, iterations on the feature, and/or going back to the drawing board for the next phase of the experiment.
A summary of the experiment should be written and documentation for the test should be created to look back on the test in the future. This should include test results, dashboard, relevant queries, and any related tickets.